Medical devices
search
news
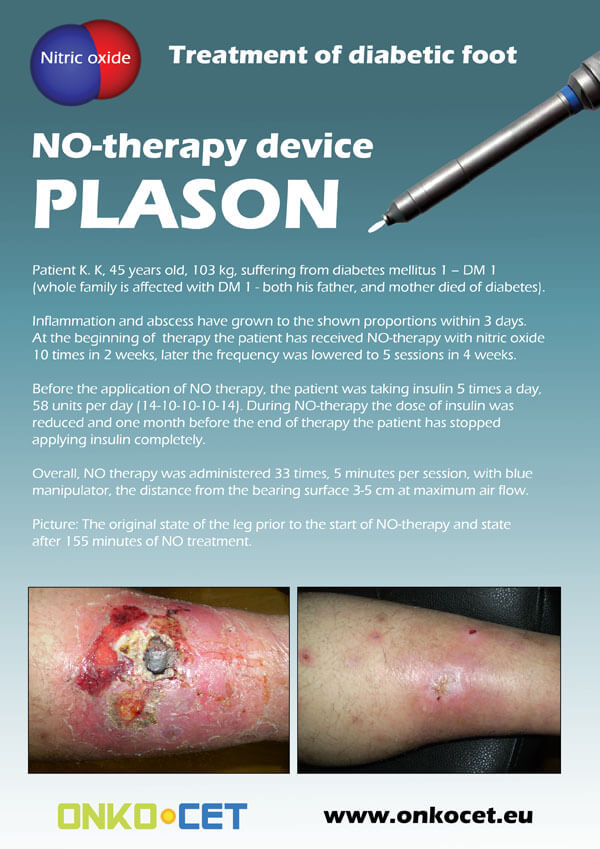
The PDF with the short report with pictures from the therapy of a diabetic foot can be viewed or downloaded here.
The pictures from the treatment of unhealing wounds an be found here:
http://www.onkocet.eu/en/produkty-detail/220/1/
The pictures from the treatment of unhealing wounds an be found here:
http://www.onkocet.eu/en/produkty-detail/293/1/
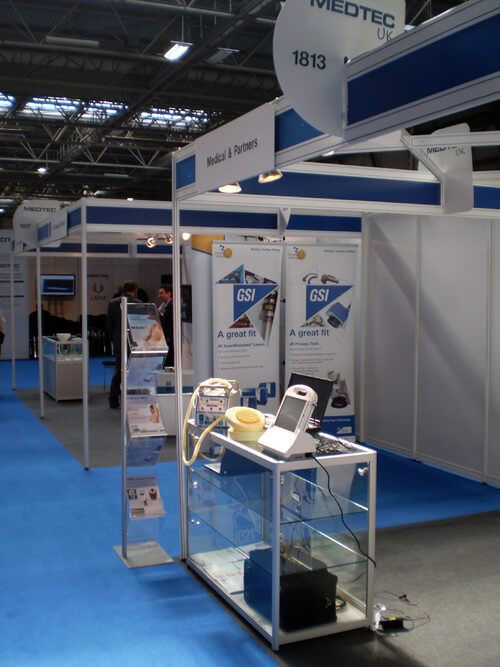
ONKOCET Ltd. has exhibited the devices from its portfolio on the MEDTEC UK exhibition in Birmingham, April 2011 through our partner Medical & Partners.
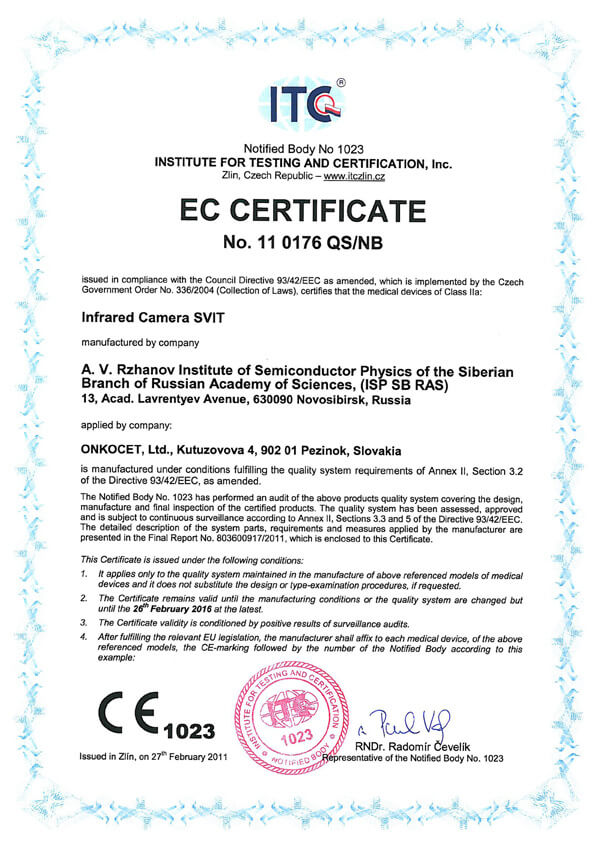 The ONKOCET company has successfully reached the certification of yet another medical device, Infrared Camera SVIT. The Certificate can be found here. The videos from the device operation can be found here.
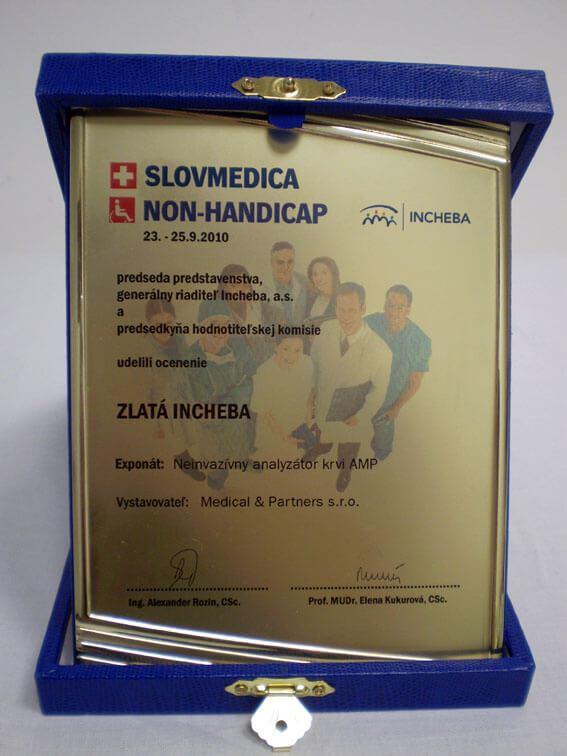 Our device, the non-invasive blood analyzer AMP has won the Golden Incheba prize at a medical exhibition SLOVMEDICA - NON-HANDICAP 2010. A big thank you goes to the organizers of the exhibition for acknowledging the quality of our device and to the exhibitor, the Medical & Partners company, for introduction of the AMP device to the medical public again.
We are pleased to inform our business partners, that our company has succesfully finished the certification process of Concor Soft Contact Lenses.
 You can find the certificate here.
More information on Concor Soft Contact Lenses go to section Medical preparations/Concor soft contact lenses, or follow this link.
 Our company has finished the certification process for another medical device, computerized spirometer MAS-1K with oximeter. You can find the device certificate here.
.jpg) Since May 2010 there is a new version of AMP device available.
Since May 2010 there is a new version of AMP device available.Follow this link if you want to see the pictures and specifications of the device.
http://www.onkocet.eu/en/produkty-detail/293/1/
 Dear partners,
 In October 2009 we have received CE certificate for another device from our portfolio, NO therapeutical device PLASON. You can find more information about this revolutionary device, used for healing of unhealing wounds, diabetic foot, or for cosmetical purposes, at our webpage, section "Medical devices" -> PLASON-NO Therapy.
.gif)
Best regards
Team of ONKOCET Ltd. company
Description of the method
Description of the method of analysis used in the device
The principle of operation is based on the new method of analysis of casual low amplitude fluctuations of the ECG signal - ECG dispersion plotting. ECG DP method is based on the informative topological model of small ECG fluctuations - ECG ITM. The main algorithm procedures of the ECG DP method is based on the following.
The multiplicity of control effects and variability of receptor signals determining electrochemical phenomena in depolarization-repolarization processes of the myocardium inevitably leads to small casual ECG fluctuations with each contraction of the heart even in the state of physiological norm. The amplitudes of these fluctuations (dispersion of fluctuations) according to the authors' data do not exceed 0.01…0.03 mV, i.e. they are several tens of times smaller than amplitudes of ECG peaks. The term "dispersion" corresponds to the generally accepted definition of difference between the maximal and minimal values of the varying quantity. In order to observe and measure the characteristics of such casual fluctuations it is necessary to plot the signals of ECG one-type peaks, i.e. synchronize the beginning of electric excitation of several successive peaks. Fig.1 and Fig.2 give examples of such low amplitude QRST fluctuations in one of the leads. Fig. 1 shows ECG low amplitude fluctuations of a healthy person, Fig.2 - in case of sub-acute stage of MI. In the cited cases one can see some characteristic amplitude and frequency peculiarities of changing fluctuations.

Fig1. ECG low amplitude fluctuation in successive QRSTcomplexes of a healthy heart.
a) single complex; b) 7 successive synchronized complexes
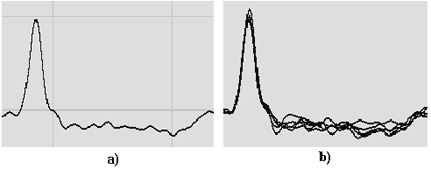
Fig. 2. ECG low amplitude fluctuation in successive QRST complexes with MI.
a) - single complex; b) 7 - successive synchronized complexes
Regularities of variation of such fluctuations due toinsignificance of the amplitude and casual nature were not studied in the generally accepted methods of ECG analysis. With the beginning and development of myocardial pathology dispersion characteristics begin to change earlier than ECG peaks. Therefore with control of dispersion characteristics it is possible to obtain information about developing pathology with forestalling. It is this principle that is used in CardioVisor-06c to raise sensitivity of the ECG analyzing technique under consideration to pathological changes. The unique peculiarity of dispersion characteristics is their high specificity in differentiation of norm-pathology states, i.e. CardioVisor-06c does not detect pathology in cases where there is no pathology.
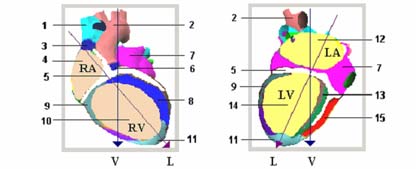
Fig.3. Visual structure of the right. sections of the heart
Fig.4. Visual structure of the left sections of the heart.
v - vertical axis of the heart L - longitudinal axis of the
1 - vena cava superior
2 - aorta
3 - rhythm integral indicator
4 - indicator of the state of RA myocardium (depolarization dispersion)
5 - indicator of P-Q interval anomalies
6 - indicator of stability of AB-conduction
7 - integral indicator of the state of two auricles (general characteristics conditioned by common source of excitation)
8 - indicator of final phase of RV depolarization (projection in the region of the interventricular septum)
9 - indicator of ventricular repolarization duration (correlates with Q - T)
10 - indicator of state of RV myocardium (repolarization dispersion)
11 - indicator of ventricular depolarization duration (QRS duration)
12 - indicator of state of LV myocardium (repolarization dispersion)
13 - indicator of final phase of LV depolarization
14 - indicator of state of LV myocardium (repolarization dispersion)
15 - indicator of final phase of RV depolarization (projection on posterior wall)
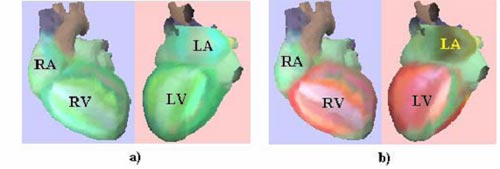
Fig.5. Examples of heart portraits. a) - norm, b) - IHD, PICS, diabetes mellitus.
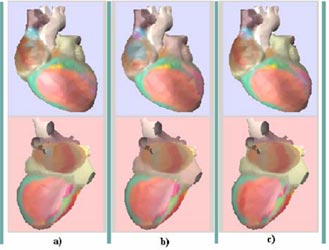
Fig .6. Reproducibility of pathological heart portrait with stable state of myocardium.
a) - first portrait, b) - 10 minutes later c) - one day later
Effectiveness of device usage
The characteristics of CardioVisor -06c considerably excel those of analogues intended for ECG screening. Suffice it to say that the time of obtaining the conclusion is 1…3 minutes, control is made without taking off clothes in the sitting position and indexes of sensitivity and specificity to ischemic heart disease increase to 80%.
For comparison: mean ECG-12 sensitivity to IHD is only 30…40%. The latter means that more than 60% of occult or pre-clinic forms of developing ischemic heart disease at present are not elicited by methods of standard ECG analysis and require applying other expensive methods of investigation (CAG, myocardial scintigraphy, etc.).
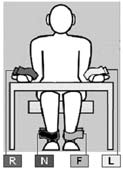
Fig. 7 Diagram of applying electrodes.
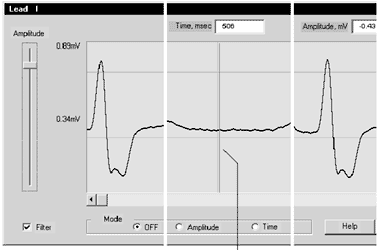
Fig. 8 ECG characteristics meter

